Microsoft 365 offers various subscription plans that a user can purchase as per their requirements. Some important plans for organizations are various versions
of the Business plan that offer a variety of benefits.
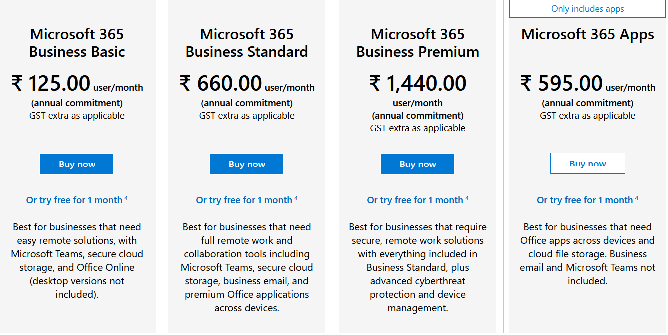
The organizations purchase the plans for multiple of their users and the features of plans allow them to collaborate on a better level. When users are accessing all the applications on their system and working separately, then you will need a secure method to track the user activities.
A majority of employees are working from their homes today, so the business owner needs to know about the regular activities of the employees so that the resources are better allocated and the performance is monitored.
Microsoft 365 is the smart platform that provides you all the features to keep checks and balances. You can visit the Reports dashboard and check the activities of users across applications. For example, you can check that which user is doing lots of email communication and which user has reached the limit of their storage quota. The reporting period is divided into several days like 7 days, 30 days, 90 days, and 180 days.
Who can access the reports?
Only the administrator and such users who have required permissions to access the reports dashboard can generate reports. Here is the list of all the user accounts who can access to reports dashboard.
- Global Administrators.
- Exchange Administrators.
- SharePoint Administrators.
- Skype for Business Administrators.
- Global reader.
- Reports reader.
- Microsoft Teams Service Administrator.
- Teams Communication Administrator.
These Administrators can create reports as their administrator range. We are showing a list of all the reports accessible in the dashboard-
- Email activity.
- Mailbox usage.
- Office activations.
- Active users.
- Email apps usage.
- Microsoft 365 Groups.
- OneDrive for Business user activity.
- OneDrive for Business usage.
- SharePoint site usage.
- SharePoint activity.
- Skype for Business Online activity.
- Yammer activity.
- Yammer device usage.
- Yammer group activity report.
- Microsoft Teams user activity.
- Microsoft Teams device usage.
Generate reports in Reports Dashboard
The Administrator can generate the report on Microsoft 365 Admin Center easily.
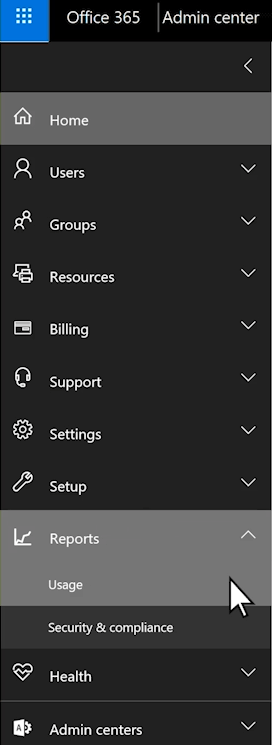
- Login to your Microsoft 365 account and go to Admin Center.
- In the list of Admin Center, go to Reports and choose Usage.
- In the Usage, you can see that the Active User report is open for multiple applications. There are color-coded details in a chart format. You can click on any point and see the details.
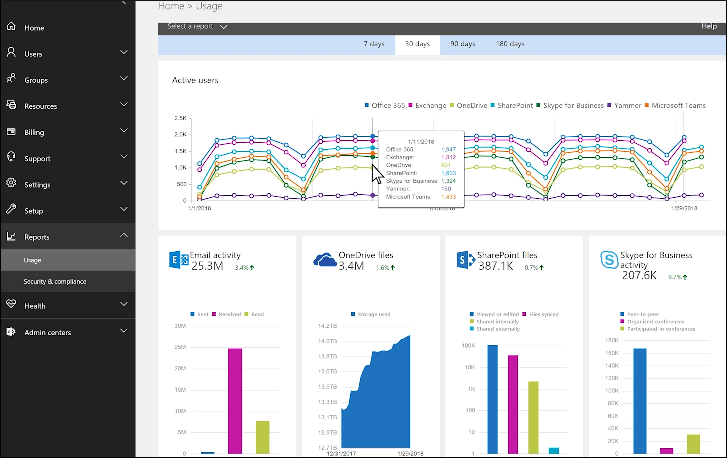
- You can click on the drop-down to choose the desired report. The reports are categorized as we mentioned earlier. You can choose anyone.
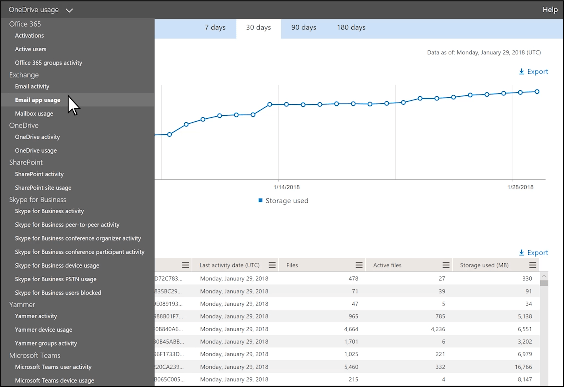
- The email app usage presents you not a single but three categories for Users, Apps, and Versions. You can also export the report by selecting the Export users.
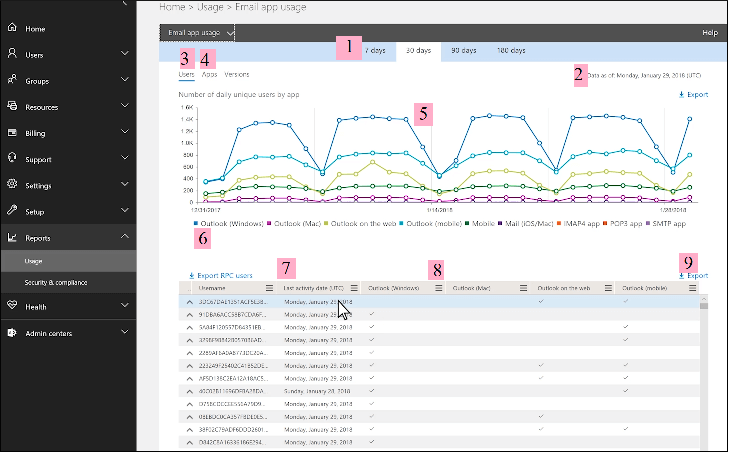
The reports page has multiple options that help you in managing the view of reports better. We have marked these options and the following table will inform you about these options.
| Option | Description |
|---|---|
| 1 | The availability of reports can be divided as per the number of days. The days are 7, 30, 90, and 180. But, you can also choose a particular day and get a report from 28 days till the day. |
| 2 | The data present in the chart has details from the last 24 to 48 hours. |
| 3 | The User option shows the details for the active users. A user is considered active when he/she has opened their account and created, edited, and modified some data in the same period. |
| 4 | The apps tab shows the selected apps from where the active users have opened their accounts. Separated apps are color-coded for easy identification. |
| 5 | The activity graph shows the details of all the apps as per the selected period. The chart is prepared in the X-Y axis and each axis is changed as per the report format. |
| > |
|
Conclusion
When the business has a great number of users working in their system separately, then the Administrator can get a report containing the information of all the email activities. If you want to upgrade your subscription plan or change the domain name, then you should use a professional Office 365 migration software that will migrate the whole user accounts along with their data. After the completion of migration, you can check the report and it will show complete information from the previous dates also.